ARM Dashboard Revamp
One command centre for rental property managers, where every number opens the screen behind it.
Managers opened five modules to answer four daily questions.
One role-aware dashboard of 13 cards, each drilling into the records behind it.
One screen for the daily overview · 13 drill-downs · 13 tracked events.
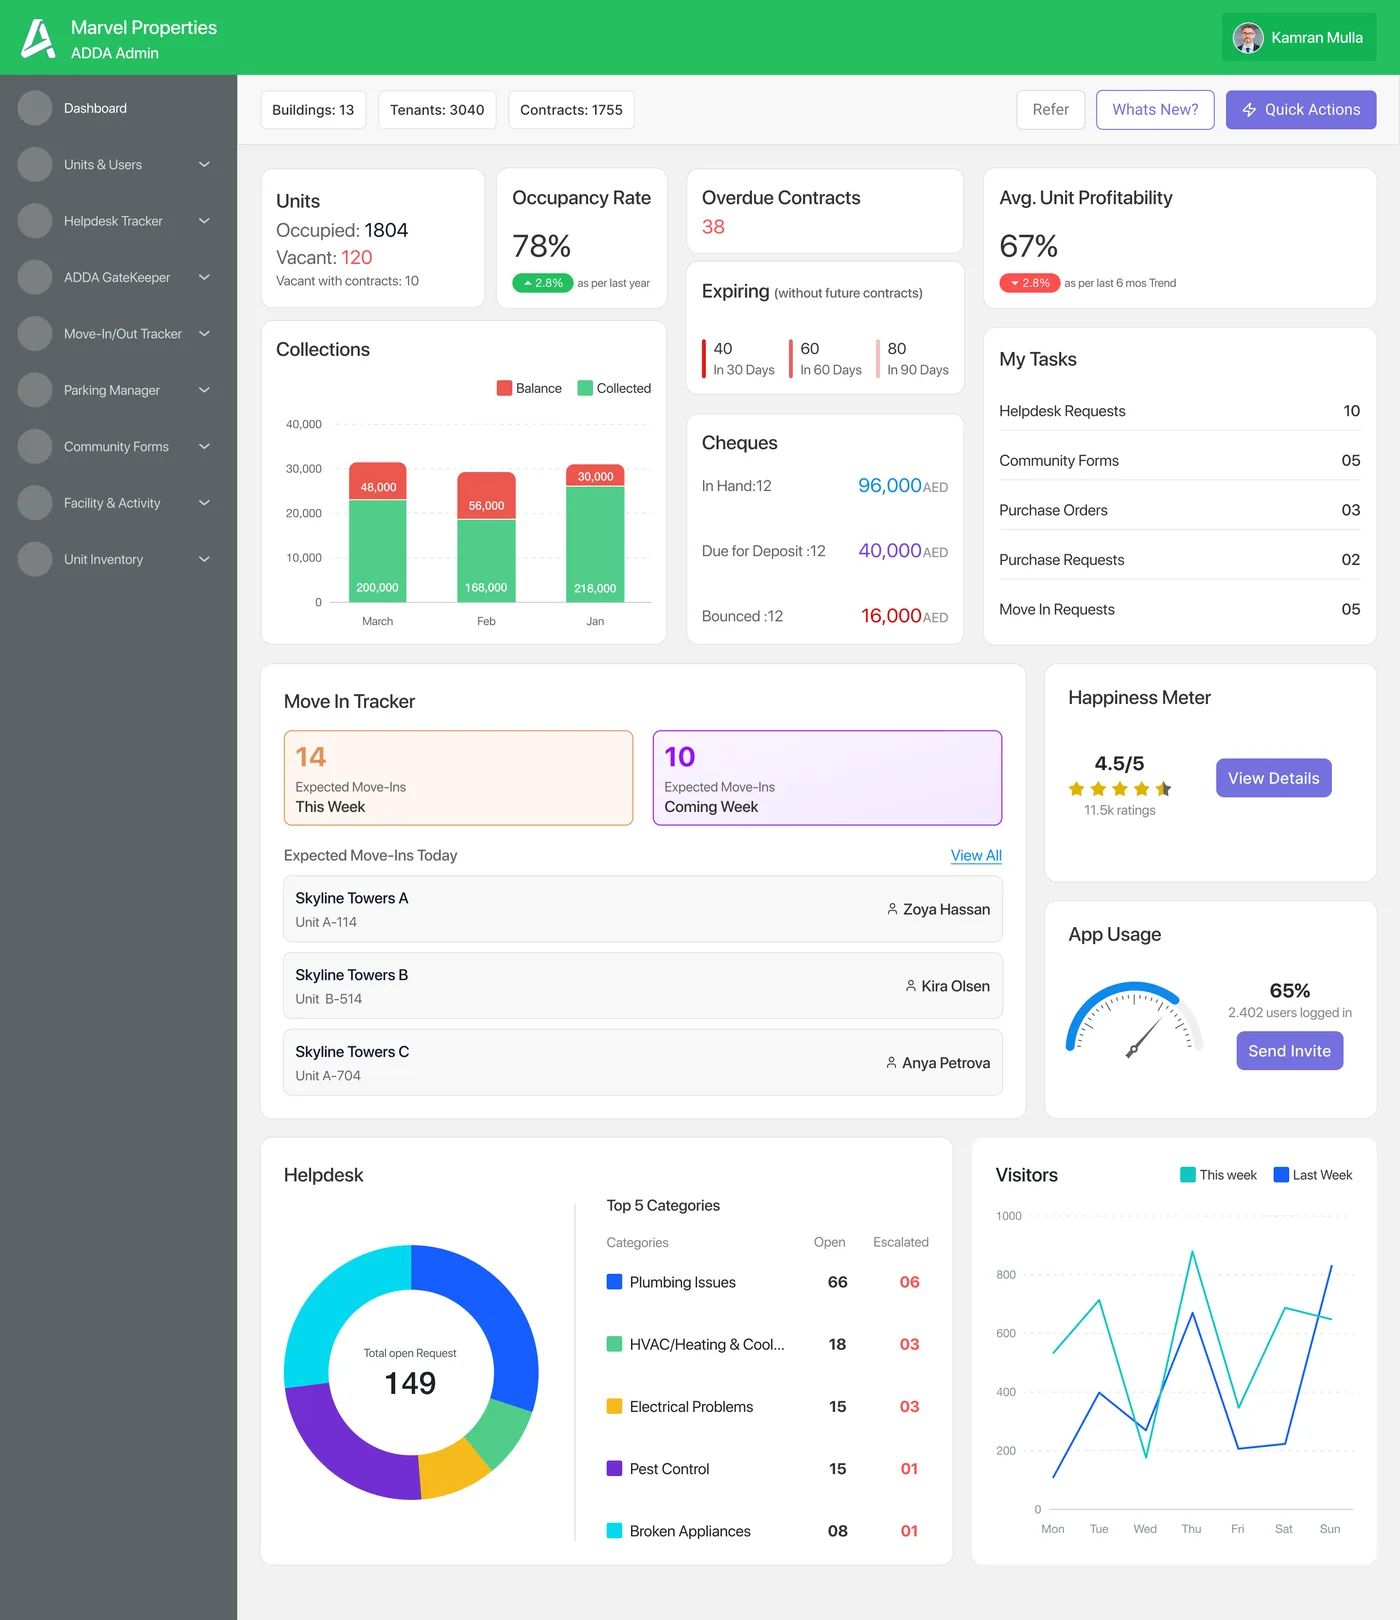
From a status page to a command centre.
ARM is ADDA’s rental management product for landlords and property managers. Its old dashboard showed data that rarely led to action, so the day still started by opening Units, Contracts, Income Tracker, Helpdesk and Move-In trackers one by one. This revamp turned the dashboard into a role-aware command centre with drill-down on every metric.
- →Shaped the scope doc and metric list with PM and stakeholders
- →Defined each card: what it answers, its formula and where it drills to
- →Designed the dashboard, quick actions and every card state
- →Planned phasing, analytics events and release notes
Simple questions took five modules to answer.
How many units are vacant right now? Which contracts expire soon? How much rent is still pending? What needs my approval today? Each answer lived in a different module, behind its own filters and reports.
Managers lost time jumping between screens, renewals and bounced cheques slipped through, and decisions waited on someone reading a report.
Eight pains from the FS.
What success looks like.
- →Answer the daily questions on one screen
- →Go from any number to the records behind it
- →Spot risk early: expiries, bounces, escalations
- →Cut navigation across ARM modules
- →A role-aware command centre for office staff
- →Measure what managers actually click
Written from the manager’s desk.
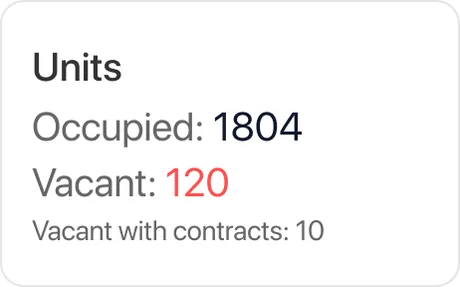
As a Property Manager, I want to see total, occupied and vacant units, so that I can monitor occupancy without opening multiple pages.
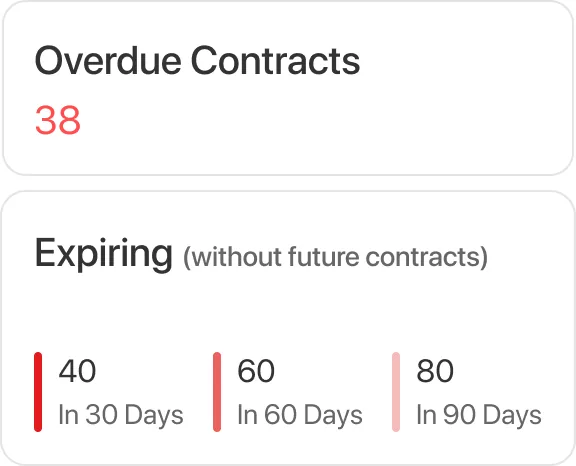
As a Property Manager, I want to view contracts expired or expiring in 30, 60 and 90 days, so that I can renew early and reduce vacancies.
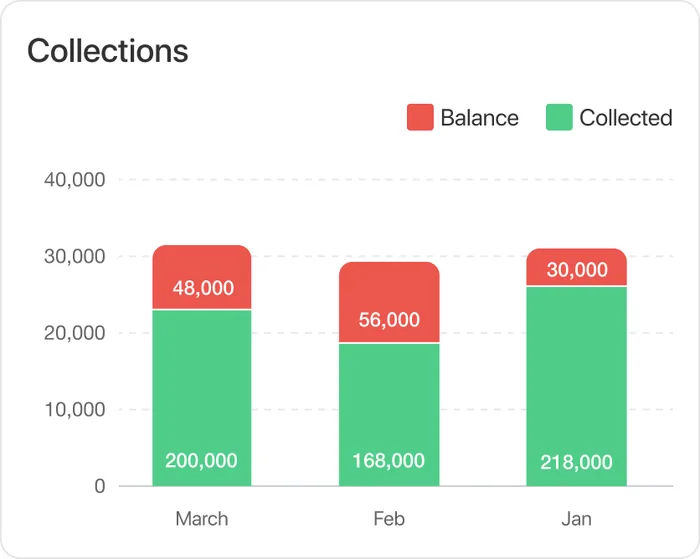
As a Property Manager, I want to view rent collected vs balance for recent months, so that I can track payment performance.
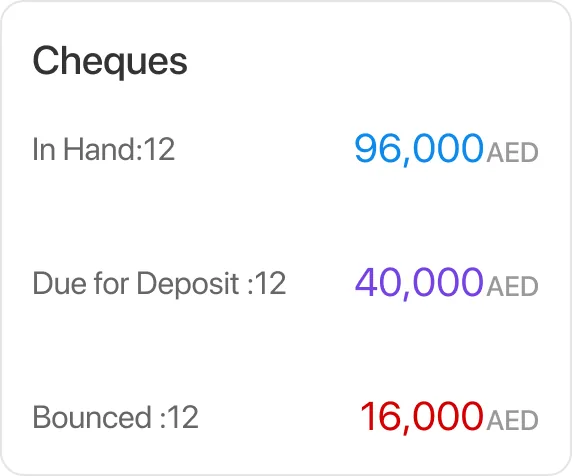
As a Property Manager, I want to see cheques in hand, due for deposit and bounced, so that financial actions happen on time.
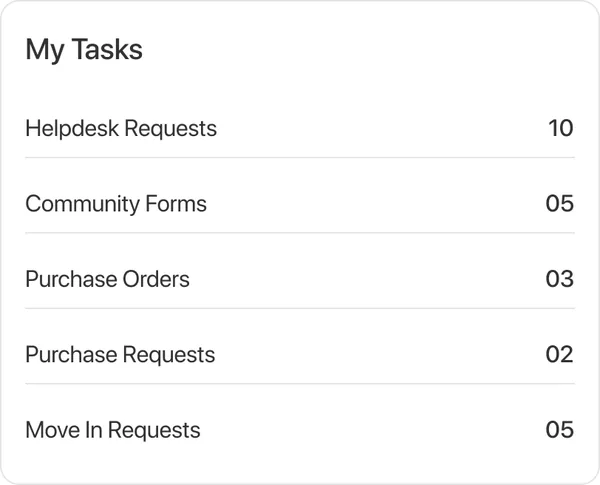
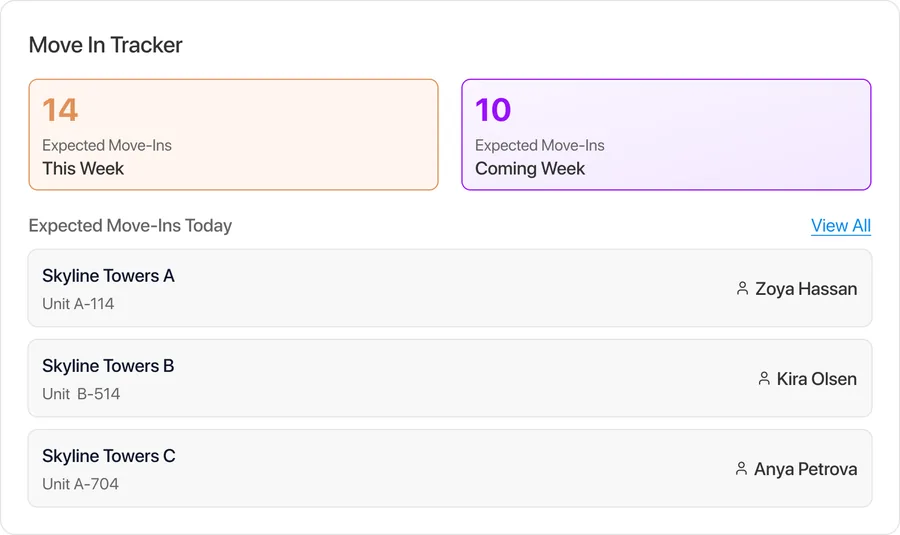
As a Property Manager, I want to see every approval waiting on me in one list, so that I never miss a helpdesk, form, PO, PR or move-in.
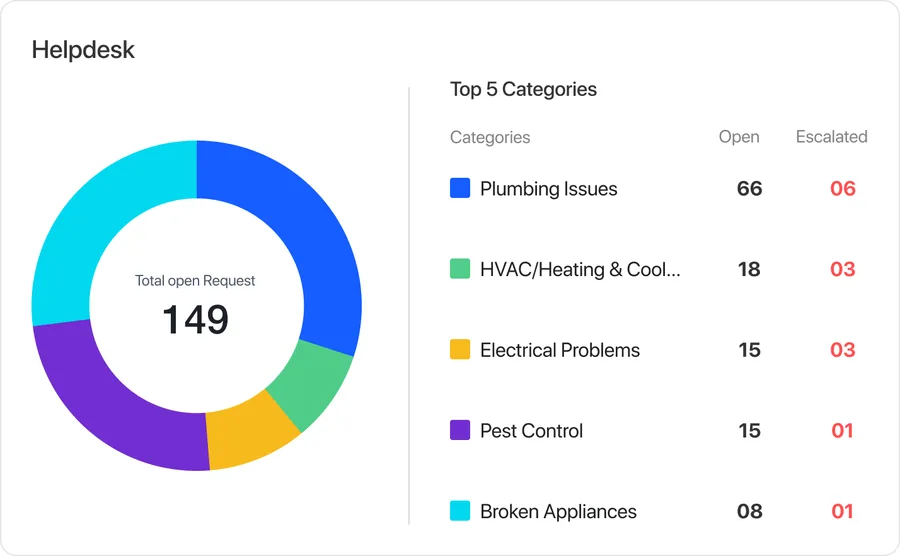
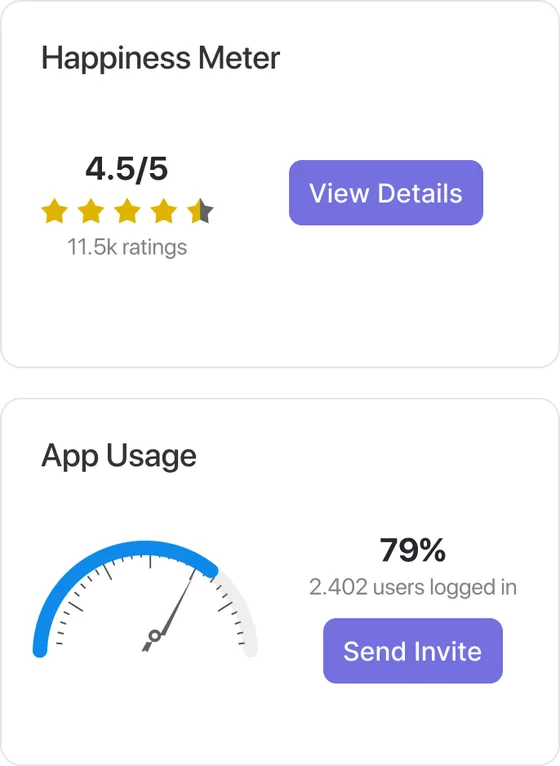
As a Property Manager, I want to see helpdesk top categories, happiness and app usage, so that I spot service problems and adoption gaps early.
Three people, one screen.
Property Manager
Runs several rental buildings; reports to owners on occupancy and rent.
- →Wants a morning overview
- →Answers owner questions fast
Leasing & Operations Coordinator
Owns renewals, approvals and service follow-ups.
- →Must not miss expiring contracts
- →Approves across many modules
Finance Executive
Tracks rent cheques and collections.
- →Needs deposit and bounce alerts
- →Wants collection trends
What we learned.
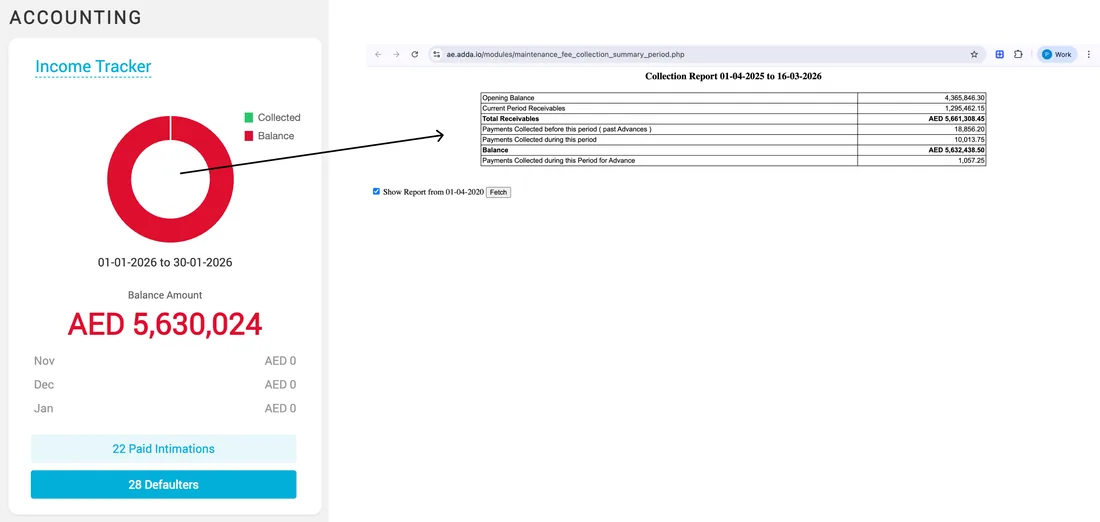
Where it fits in ARM.
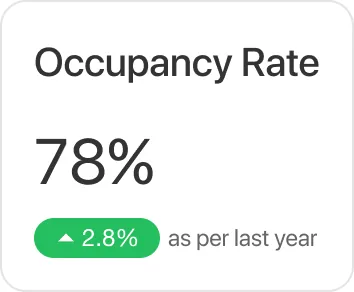
- →Occupancy = units with tenants ÷ total units × 100
- →Expiring counts include today; Overdue = already expired
- →Collections show the current and two previous months
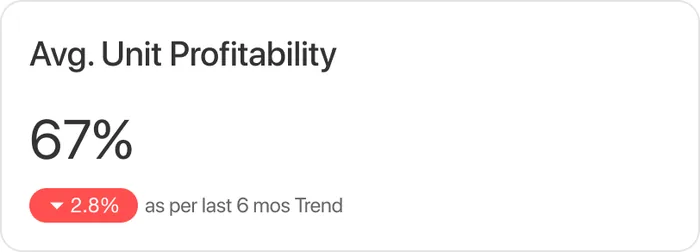
- →Avg. Unit Profitability = average of (income − expense) ÷ income per unit
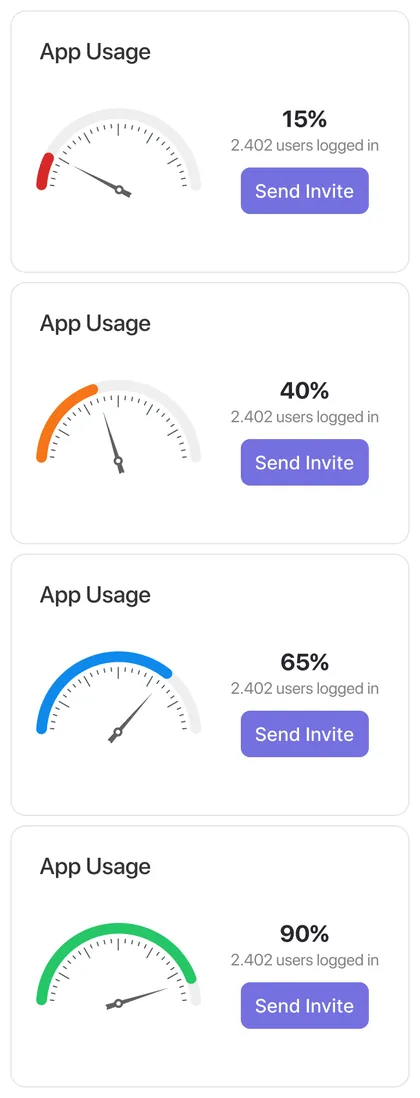
- →App usage bands: ≤20%, ≤40%, ≤60%, ≤80% and above
- →Visible to Office Staff in ARM ADDAs only
The hard parts.
How I got there.
Eight areas, mapped to the pains.
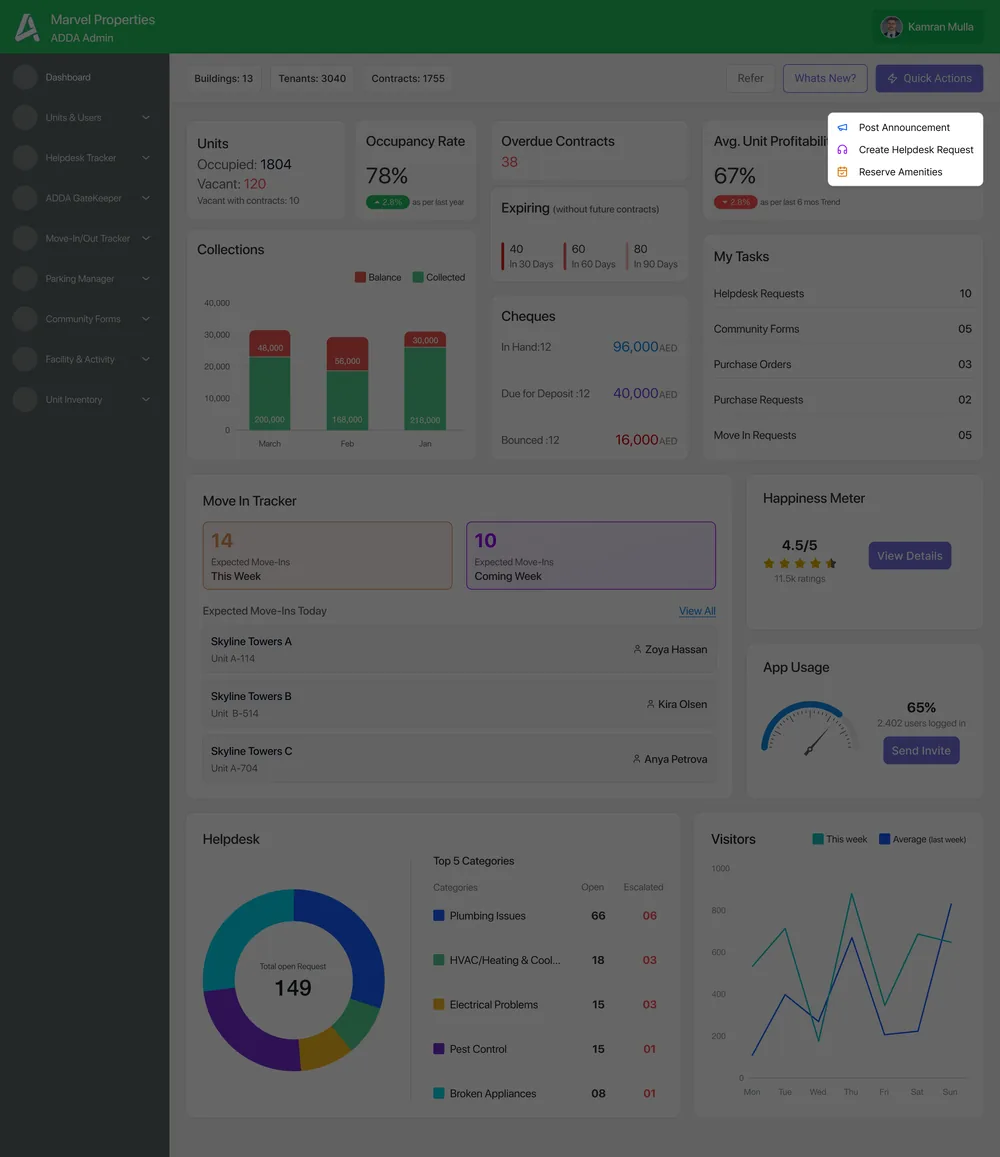
Edge cases, handled.
Unit cards open the master report for moderators, the first unit for others.
Shown as “Overall” for now, until the P&L report supports date ranges.
Phase 1 hides “View Details” and centres the card; phase 2 adds the report.
Links to the unit occupancy report until the landlord report ships.
Shown in yellow, not green or red.
Expiring excludes contracts already renewed into a future term.
The gauge changes colour by band, from red to green.
Only categories with requests appear in the top five.
Impact and what’s next.
- →A dashboard is a list of next steps
- →Every number needs a home to drill into
- →Phase honestly: hide what you can’t explain
- →Unit-wise P&L with date ranges, then the profitability trend
- →Happiness Meter report and “View Details”
- →Role-based layouts for owners and finance